A sample-size calculator, a survival DGM explorer, multi-state and partitioned-survival explorers, a hazard-ratio explainer, a Kaplan–Meier reconstruction tool, a model chooser and a merlin model builder — all client-side, all exporting to R and Stata.
Eight interactive tools now sit under reddooranalytics.se/tools. They cover the questions that come up before a study starts, and they are easier to answer with a curve in front of you than in an email.
Each one runs entirely in your browser. Nothing is uploaded and nothing is installed — set the inputs, watch the curves and the numbers update, and read the answer off. That is a design choice rather than a technical convenience: study designs and trial data are not ours to receive, and the reliable way to guarantee that is to build tools that cannot receive them.
Each also exports what you have built to R or Stata in one click, using our own packages. The tool is where you work the problem out; the export is where you do the analysis.
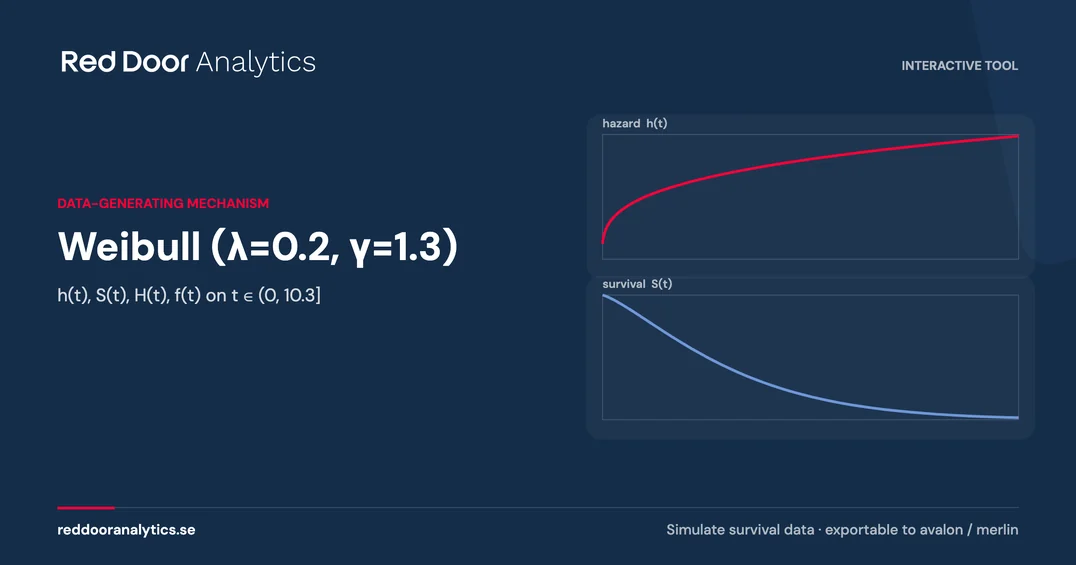
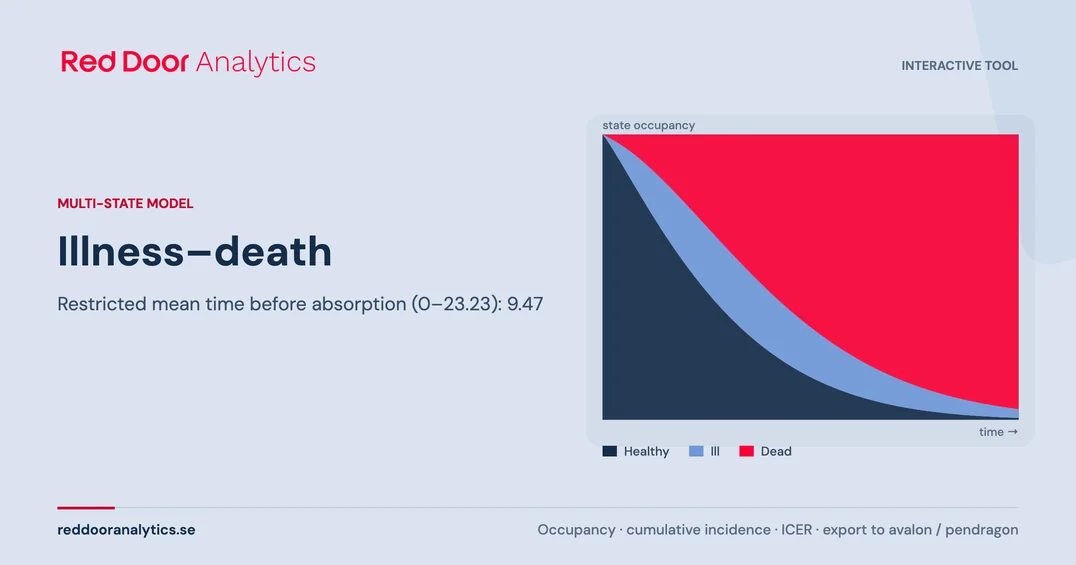
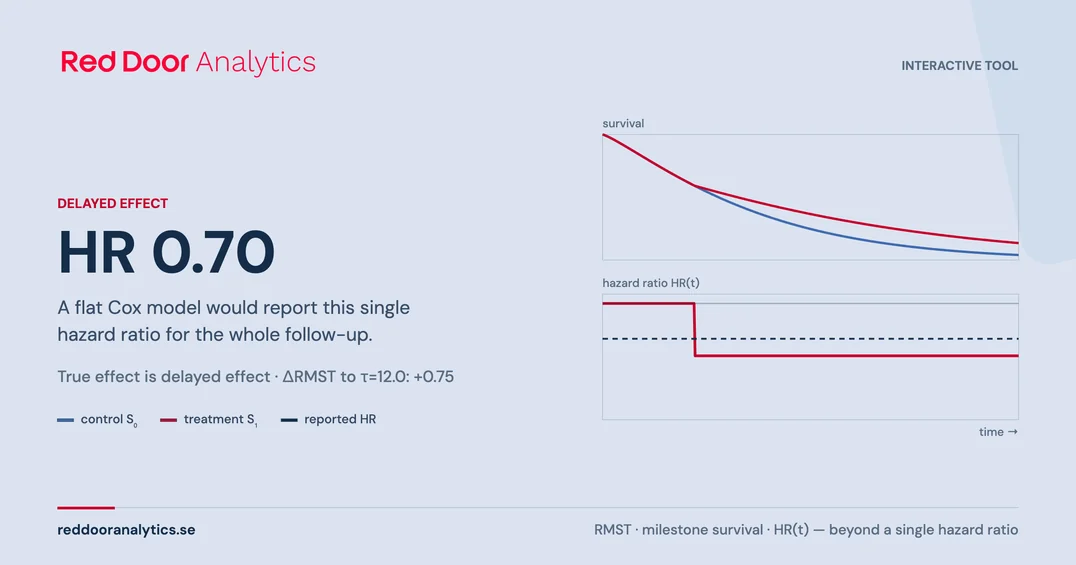
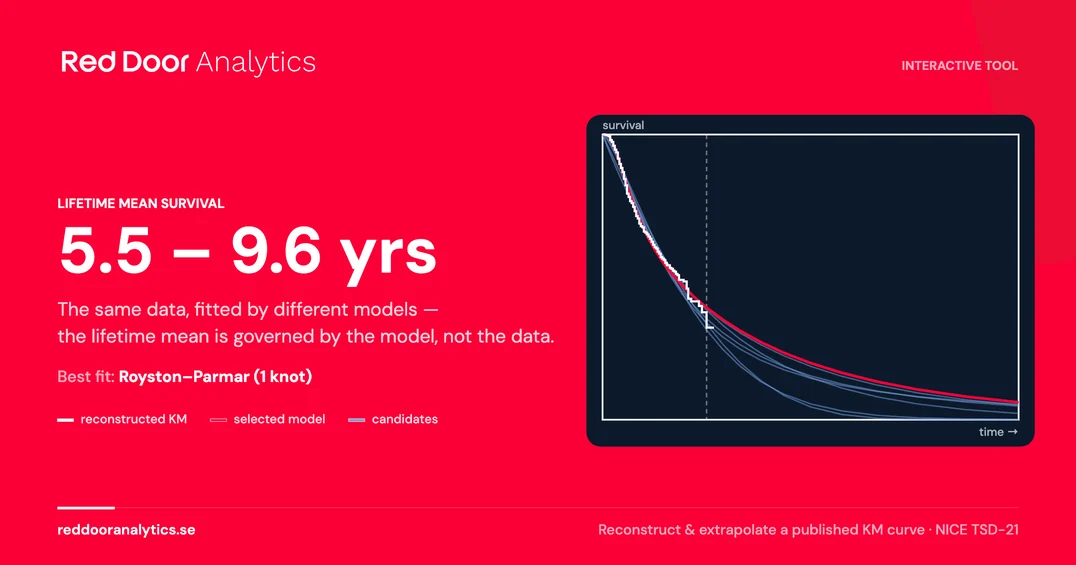
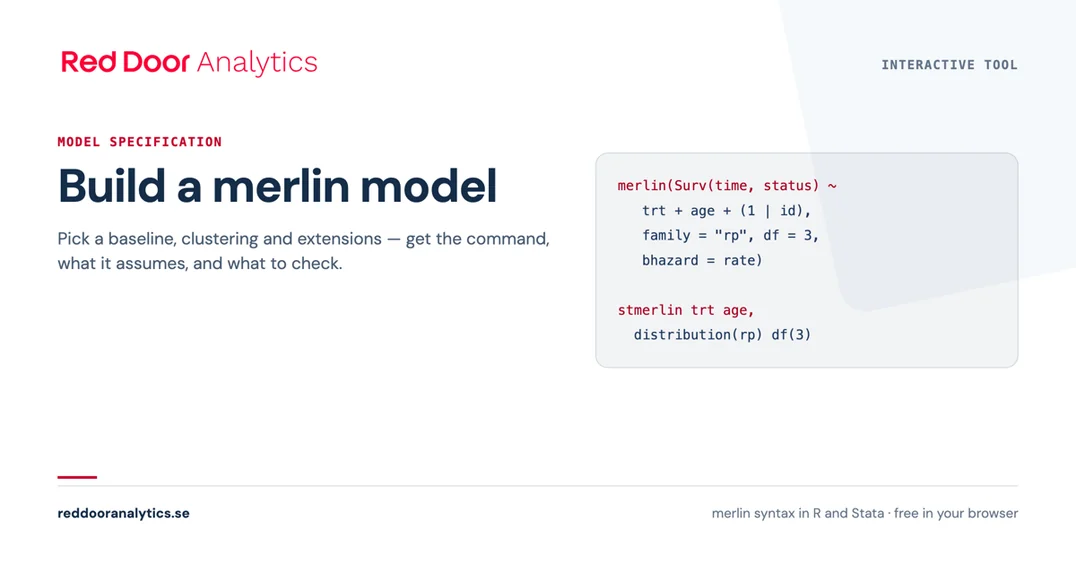
Sample size & power calculator — Two-sample means, proportions, log-rank survival and Cox regression, plus a flexible parametric survival explorer powered by merlin. Open the tool →Survival DGM explorer — Choose a data-generating mechanism for simulating survival data — standard parametric distributions, Royston–Parmar splines, mixture and cure models — with live hazard and survival curves, and one-click avalon or merlin export. Open the tool →Multi-state & competing-risks explorer — Illness–death, competing-risks and progression models with live state-occupancy and cumulative-incidence curves, restricted mean time in state, a two-arm treatment effect, and health-economic outputs. Open the tool →When the hazard ratio misleads — See how a single Cox hazard ratio hides a delayed, waning or crossing treatment effect — and how the hazard ratio over time, restricted mean survival and milestone survival tell the real story. Open the tool →Reconstruct & extrapolate a KM curve — Reconstruct individual patient data from a published Kaplan–Meier curve by Guyot reconstruction, fit parametric and flexible-parametric models in the browser, and extrapolate to a lifetime horizon. Open the tool →Partitioned survival analysis explorer — Set progression-free and overall survival curves and watch three-state occupancy, length of stay and the cost-effectiveness outputs update live — including the curve-crossing coherence pitfall, and export to merlin or pendragon. Open the tool →Which model do I need? — Answer a few questions about the shape of your data and leave with a named model, the command in R and Stata, and a tutorial that works it end to end — or a plain statement that your design needs a conversation, not a default. Open the tool →Build a merlin model — Pick the baseline hazard, the clustering and the extensions, and leave with the syntax in both languages — together with what you have just assumed, and what to check before you trust it. Open the tool →
All eight are free, and there is no sign-up. If one of them is close to what you need but not quite it, tell us — several started as something we built once for a project and then found we wanted again.
Want to discuss this work?
Whether it's the methods behind this, a related project, or how it applies to your own data — we'd be glad to talk.