The Cox model

The Cox model, also known as the proportional hazards model, is a popular statistical tool used to analyse survival data. It was developed by British statistician Sir David Cox, and published in 1972.

It has gained popularity largely by avoiding making parametric assumptions about the shape of the baseline rate in a survival model.

The Cox model estimates the relationship between a set of covariates and the hazard function, which represents the probability of an event occurring at a given time, given that it has not occurred before that time.

The Cox model is a semi-parametric model, meaning that it makes some assumptions about the underlying distribution of the data but does not require complete specification of the distribution.

Instead, it assumes that the hazard function is a product of two components: a baseline hazard function that describes the underlying risk of the event over time, and a set of covariate effects that modify the baseline hazard function for each individual.

Modelling is done on the scale of the hazard function, h(t), which is defined as:
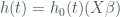
h(t) = h_{0}(t)(X\beta)

where h_{0}(t) is the baseline hazard function, and X\beta the linear prediction representing the covariate effects.

A regular Cox model assumes that the hazard function is proportional over time, which means that the ratio of the hazard functions for any two individuals is constant over time. However, this assumption can be relaxed.

Latest Resources

Specialist subjects

Real-world evidence (RWE)

Real-world evidence (RWE) Data and information that, unlike data generated in clinical trials conducted in controlled environments, has been obtained from everyday clinical practice, patient registers, or other sources outside the clinical trial setting.   RWE plays a crucial role in complementing traditional clinical trial data, providing insights into the safety, effectiveness, and overall performance […]
Read more

Videos

State-of-the-art statistical models for modern HTA

At @RedDoorAnalytics, we develop methodology and software for efficient modelling of biomarkers, measured repeatedly over time, jointly with survival outcomes, which are being increasingly used in cancer settings. We have also developed methods and software for general non-Markov multi-state survival analysis, allowing for the development of more plausible natural history models, where patient history can […]
Read more

Videos

Multilevel (hierarchical) survival models: Estimation, prediction, interpretation

Hierarchical time-to-event data is common across various research domains. In the medical field, for instance, patients are often nested within hospitals and regions, while in education, students are nested within schools. In these settings, the outcome is typically measured at the individual level, with covariates recorded at any level of the hierarchy. This hierarchical structure […]
Read more

Statistical Primers

What are competing risks?

Competing risks In survival analysis, competing risks refer to the situation when an individual is at risk of experiencing an event that precludes the event under study to occur. Competing risks commonly occur in studies of cause-specific mortality, as all other causes of death than the one under study might happen before the individuals “have […]
Read more

Statistical Primers

What is immortal time bias?

Immortal time bias Immortal time bias is a type of bias that can occur in observational research when the study design allows for a period of time during which the outcome of interest cannot occur, often referred to as “immortal time”. Simply put, immortal time bias occurs when information from a future event is incorporated into the […]
Read more

Statistical Primers

What is the proportional hazards assumption?

Proportional hazards Proportional hazards in survival analysis means that the rate at which an event of interest occurs over time for two or more groups or individuals is proportional over time. Specifically, it assumes that the hazard ratio, which represents the relative rate of an event occurring between two groups or individuals, is constant over […]
Read more

Statistical Primers

What is censoring?

Censoring refers to a situation in survival analysis where the event of interest is not observed for some of the individuals under study. In this Statistical Primer, we’ll define three types of censoring often seen in survival analysis studies. Censoring occurs when the information on the survival time is incomplete or only partially observed. Censoring […]
Read more

Statistical Primers

What is the Cox model?

The Cox model The Cox model, also known as the proportional hazards model, is a popular statistical tool used to analyse survival data. It was developed by British statistician Sir David Cox, and published in 1972. It has gained popularity largely by avoiding making parametric assumptions about the shape of the baseline rate in a […]
Read more

Statistical Primers

What is survival analysis?

Survival analysis is a statistical method used to analyse the time until an event of interest occurs. The key feature of survival analysis is that the outcome has two dimensions: – an event indicator (yes/no), and – the time spent at risk for the event All survival analyses require precise definitions of start and end of […]
Read more

Tutorials

Multivariate joint longitudinal-survival models

Joint longitudinal-survival models have been widely developed, but there are many avenues of research where they are lacking in terms of methodological development, and importantly, accessible implementations. We think merlin fills a few gaps. In this post, we’ll take a look at the extension to modelling multiple continuous longitudinal outcomes, jointly with survival. For simplicity, I’ll concentrate […]
Read more

Tutorials

Simulation and estimation of three-level survival models: IPD meta-analysis of recurrent event data

In this example I’ll look at the analysis of clustered survival data with three levels. This kind of data arises in the meta-analysis of recurrent event times, where we have observations (events or censored), k (level 1), nested within patients, j (level 2), nested within trials, i (level 3). Random intercepts The first example will […]
Read more

Tutorials

Probabilistic sensitivity analysis and survival models

Today we’re going to take a little look into probabilistic sensitivity analysis (PSA), and how it can be implemented within the context of survival analysis. Now PSA is used extensively in health economic modelling, where a particular parameter (or parameters) of interest, are altered or varied, to represent different scenarios and levels of variation. We […]
Read more
All Resources